Self-Organizing Map (SOM)
A self-organizing map (SOM) is a type of competitive network that learns to represent the structure of input data in a spatially organized way. For example, an SOM exposed to a dataset of different smells will learn to distinguish those smells over time. Importantly, the positions of neurons in the SOM are significant: nearby neurons come to represent similar inputs. In a smell network, one group of neighboring neurons might come to represent different cheese smells, while another group might represent different flower smells.
SOMs serve dual roles in computational neuroscience and machine learning. As a biological model, they illustrate how spatially organized maps representing input space can develop in the brain through unsupervised learning, similar to topographic maps found in sensory cortices. As an ML tool, SOMs were historically popular for dimensionality reduction and data visualization, particularly for their ability to preserve topological relationships in the data. While modern deep learning approaches like autoencoders and t-SNE have largely superseded SOMs for many applications, SOMs remain valuable for their interpretability and continue to be used in domains where understanding the spatial organization of learned representations is important.
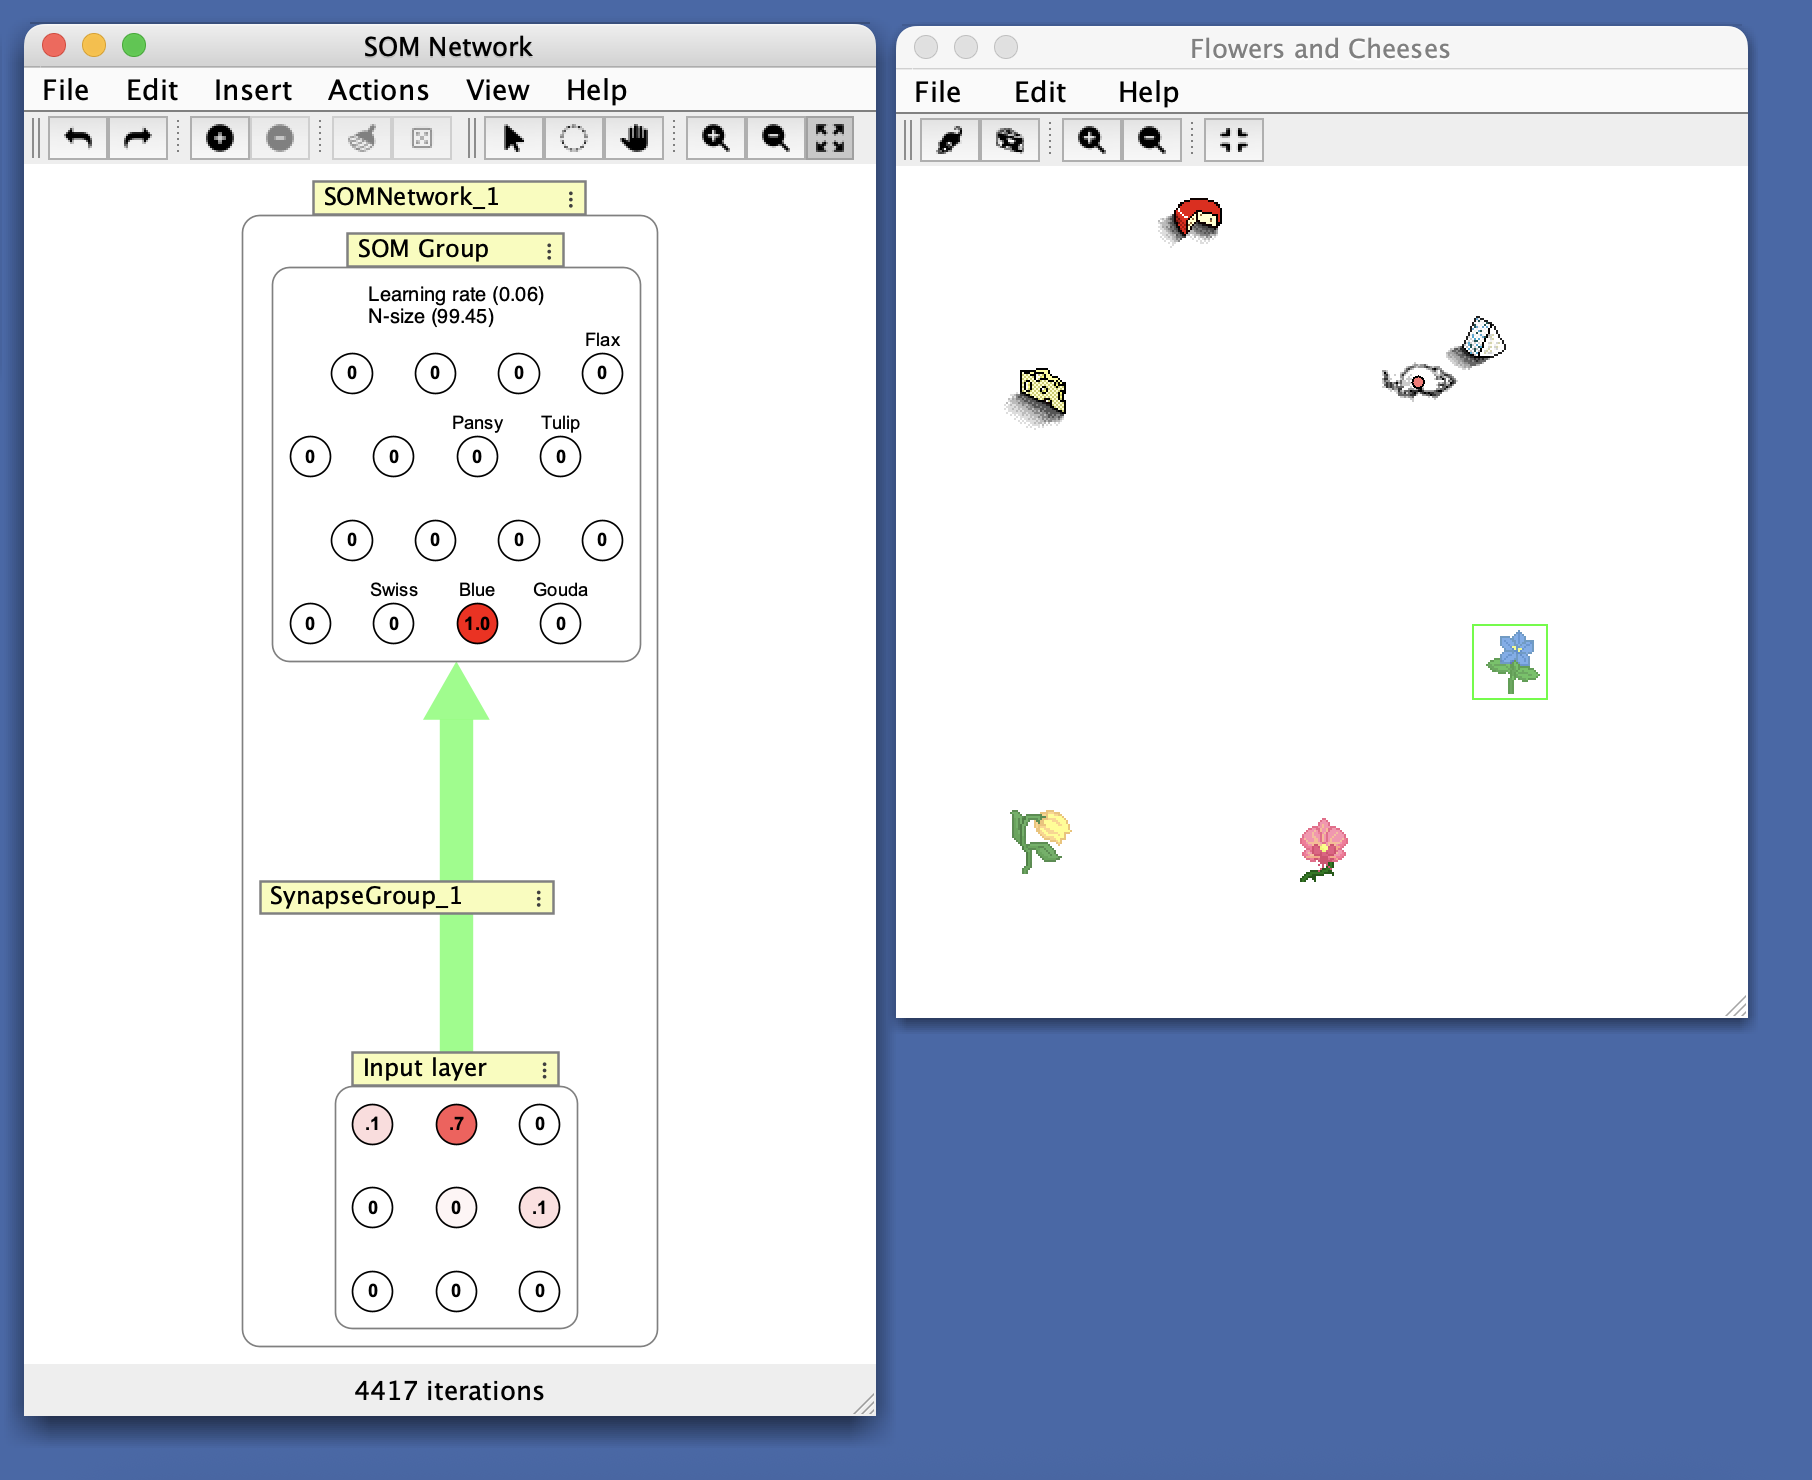
From the Simulations > Competitive > SOM network simulation. This SOM has been trained to distinguish different smells. Notice that the cheese sensors are near each other and the flower sensors are also grouped together.
An SOM may be used standalone (connected to other neurons by the user) or as part of a pre-configured SOM network that includes an input layer and training interface.
Algorithm
Intuitively, the algorithm works by taking an input, finding the output neuron whose weights most closely match the input (the “winner”) and then updating the winning neuron’s weights so that they match the inputs more closely. The weights are not only updated on the winning node, but also on other neurons in a neighborhood around the winning node. Over time the learning rate and neighborhood size decrease to 0. Thus the neurons in an SOM correspond to a kind of “map” of the input space, whereby nearby neurons correspond to similar patterns in the input data.
The following algorithm is run on each iteration:
- Determine the SOM neuron which is closest to the input vector by computing the following for each SOM neuron:
where \(i\) and \(j\) are the dimensions of the weight matrix \(w\), and \(x\) is the input vector.
- Update the winning neuron and the neurons in its update neighborhood:
where \(\alpha\) is the current learning rate.
- Diminish learning rate and neighborhood size.
The effect of the algorithm is that the SOM neurons become characteristic of the trends of input patterns.
Initialization
SOMs are initialized by specifying a number of neurons and a layout. The layout is important because the SOM works by updating a winning neuron and neighboring neurons. By default, SOMs use a hexagonal grid layout.
Input connections should be fully connected to the SOM group. The synapses should be either small or sampled evenly from the subspace spanned by the two largest principal component eigenvectors.
Parameters
- Initial learning rate: The starting learning rate from which all future learning rates are derived. This decreases over time during training.
- Initial Neighborhood size: The starting radius around the winning neuron within which learning takes place. This decreases over time during training.
- Learning decay rate: The rate at which the learning rate decreases after each iteration.
- Neighborhood decay rate: The amount that the neighborhood size decreases after each iteration.
Right Click Menu
Generic right-click items are described on the neuron group page.
- Edit / Train SOM: Opens edit dialog to edit and train the SOM group.
- Reset SOM Network: Reset the learning rate and neighborhood size to their initial values.
- Recall SOM Memory: Set the input neuron activations to match the weights of the most active SOM neuron. This displays what pattern the currently active SOM neuron represents.
- Randomize Synapses: Randomize synapses connected to the SOM group.
References
- Kohonen, Teuvo (1990), The Self Organizing Map, Proceedings of the IEEE, 78:9.