Pie Chart
A standard pie chart for representing the relative sizes of a set of quantities.
In Simbrain, slice sizes are determined by the absolute values of the input vector. This means a large negative activation will be treated the same as a large positive activation, and both will take up a proportionally larger “slice of the pie”.
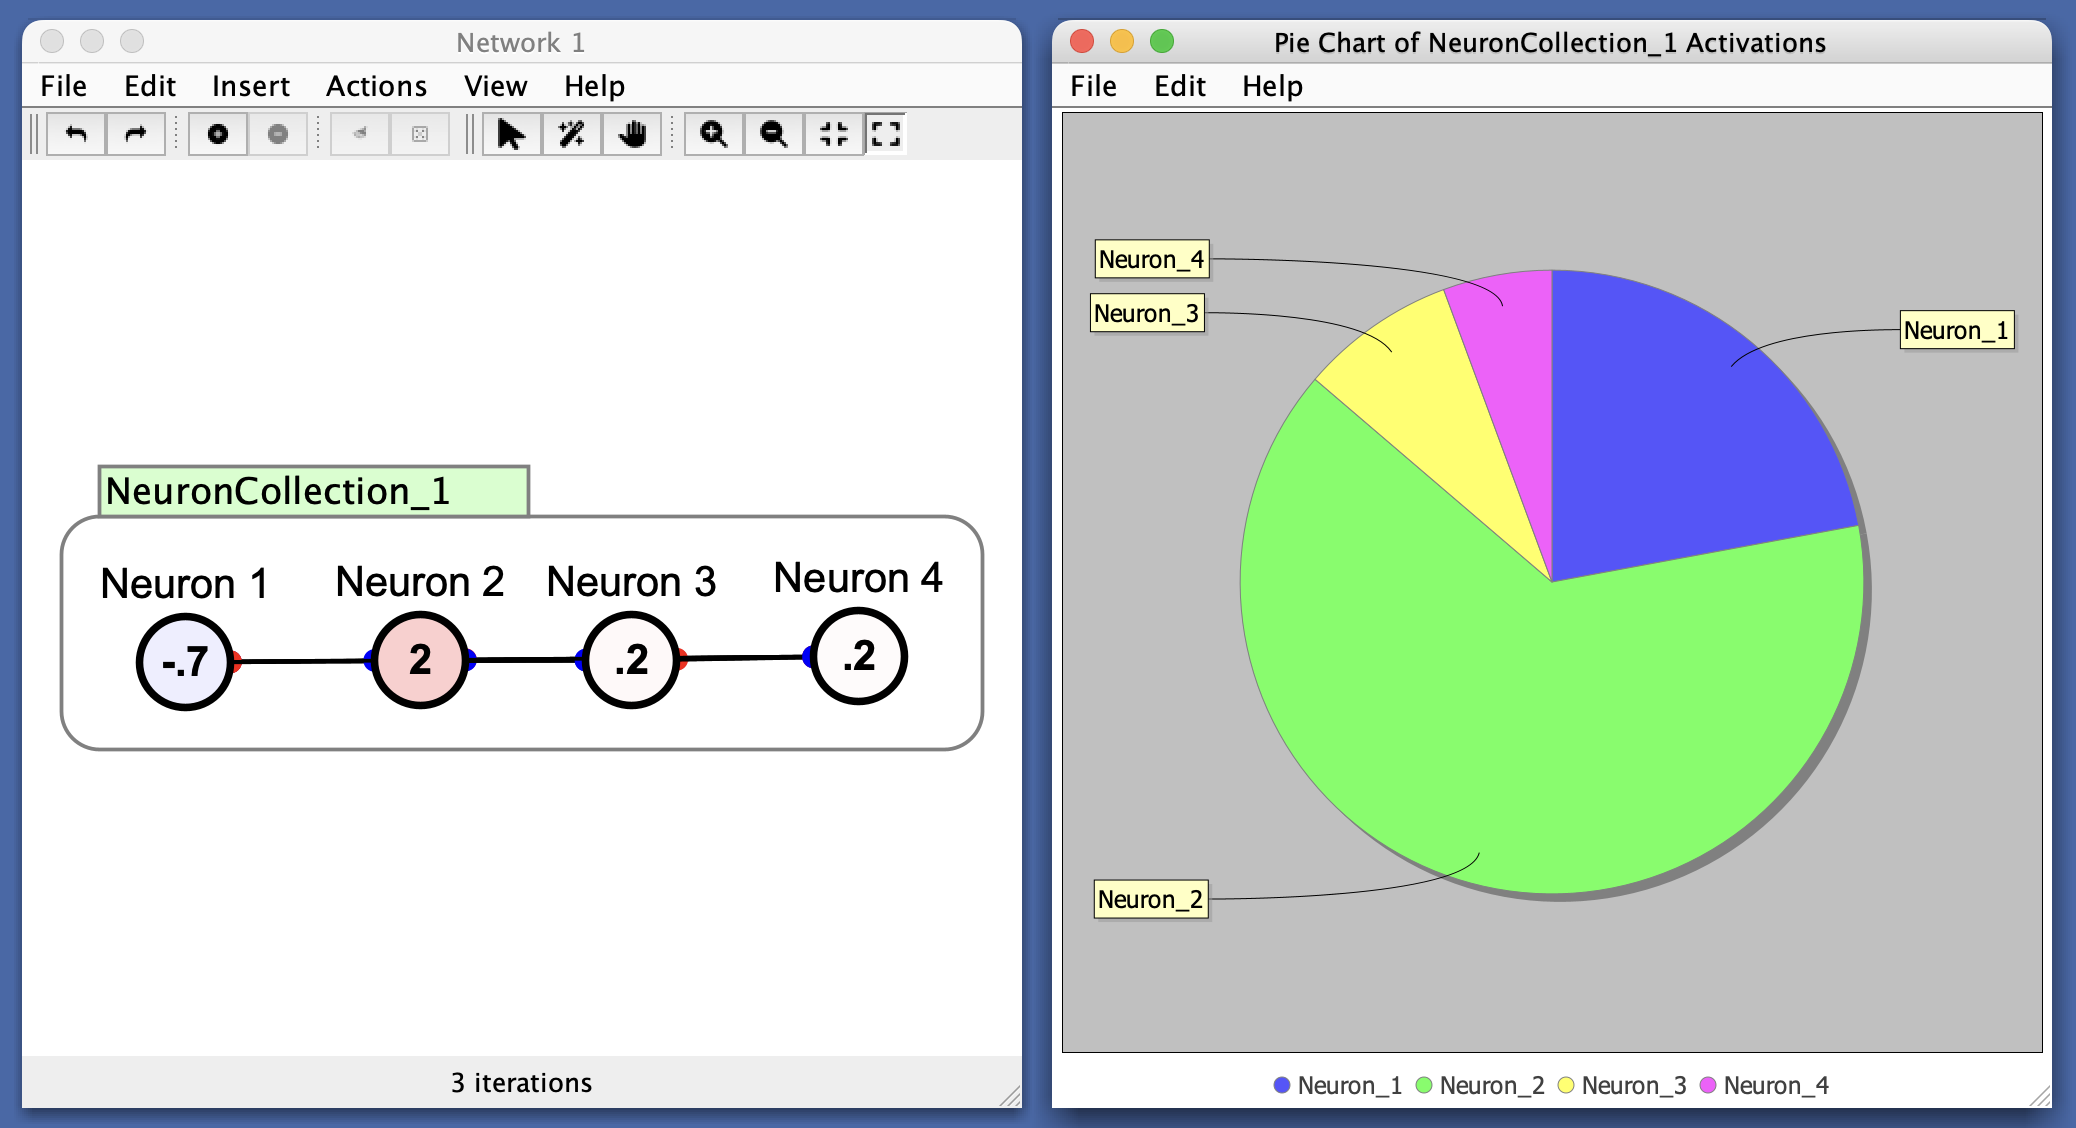
This can useful for visualizing how activations are distributed across a set of neurons. For example:
- If one neuron dominates, its slice will be large.
- If all neurons are equally active, slices will be equal.
Similarly for weight strengths, etc.
Preferences
- Empty Pie Threshold: If the total activation (sum of absolute values) falls below this threshold, the chart displays a single “Empty pie” slice. This prevents the appearance of misleading visuals when all values are near zero. To always show the relative proportions of even small values, set this threshold to 0.
Menus
File
- Import from XML: Load a previously saved pie chart.
- Export to XML: Save the current pie chart.
- Rename: Rename the pie chart window.
- Close: Close the pie chart window.
Edit
- Preferences: See preferences.
Help
- Help: Link to Simbrain Documentation
Right-Click Menu
- The context menu is a JFreeChart menu.