Histogram
A histogram can be used to plot a distribution of values. A histogram partitions the range of a given dataset into a number bins, and counts the number of values in the data set which fall into each bin. In Simbrain bins equally divide the range of the dataset such that each bin takes on the same width.
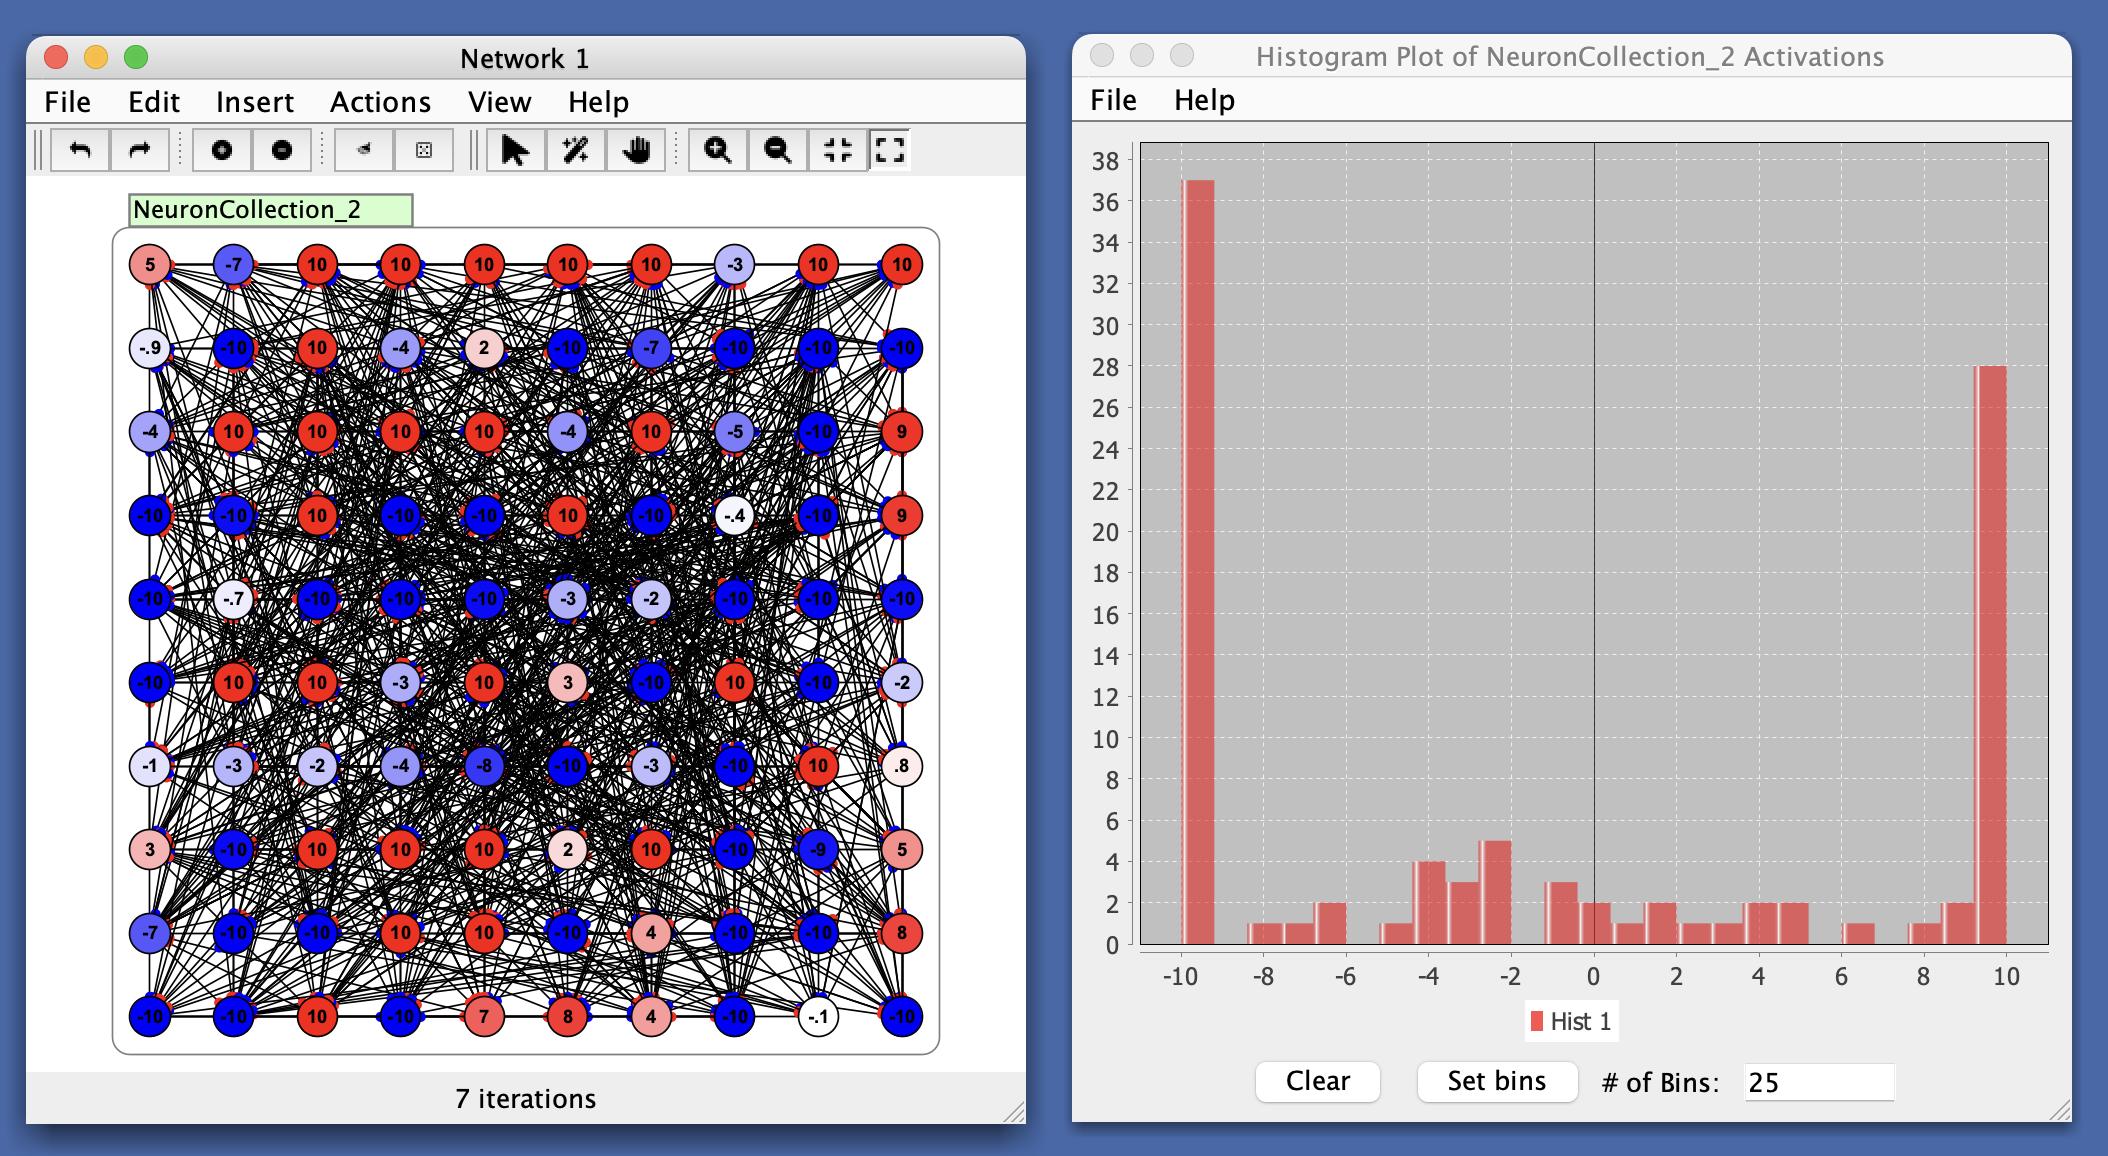
Neuron arrays, weight matrices, and other array values can be coupled to a histogram to view the distribution of activations of weight strengths as a network is updated or trained.
In the example below, notice that 36 neurons are at their minimum value while 27 are at their max value, due to ceiling effects (when nodes are bounded, they are clipped at their minimum and maximum values.)
As with other plots, several simultaneous datasets (histograms) can be displayed. Each will be displayed in a different color. For an example along these lines see the synapse adjustment dialog.
Panel Buttons
- Clear: Clear all data from the histogram.
- Set bins: Apply the number of bins specified in the adjacent text field. The number of bins determines how the data range is divided for counting values.
- # of Bins: Text field where you can enter the desired number of bins for the histogram.
Menus
File
- Import from XML: Load a previously saved histogram.
- Export to XML: Save the current histogram.
- Rename: Rename the histogram window.
- Close: Close the histogram window.
Help
- Help: Link to Simbrain Documentation
Right-Click Menu
- The context menu is a JFreeChart menu.