Raster Plot
A raster plot is a graphical representation of spiking activity across a group of neurons over time. Each dot in the plot represents a spike by a neuron at a specific moment.
- The x-axis shows time steps.
- The y-axis shows neuron indices (often interpreted as “neuron number”).
- A dot at position \((t, i)\) means neuron \(i\) fired (spiked) at time \(t\), or (for non-spiking neurons) that the neuron was active above a threshold.
Basically each row represents a single neuron’s spiking activity over time.
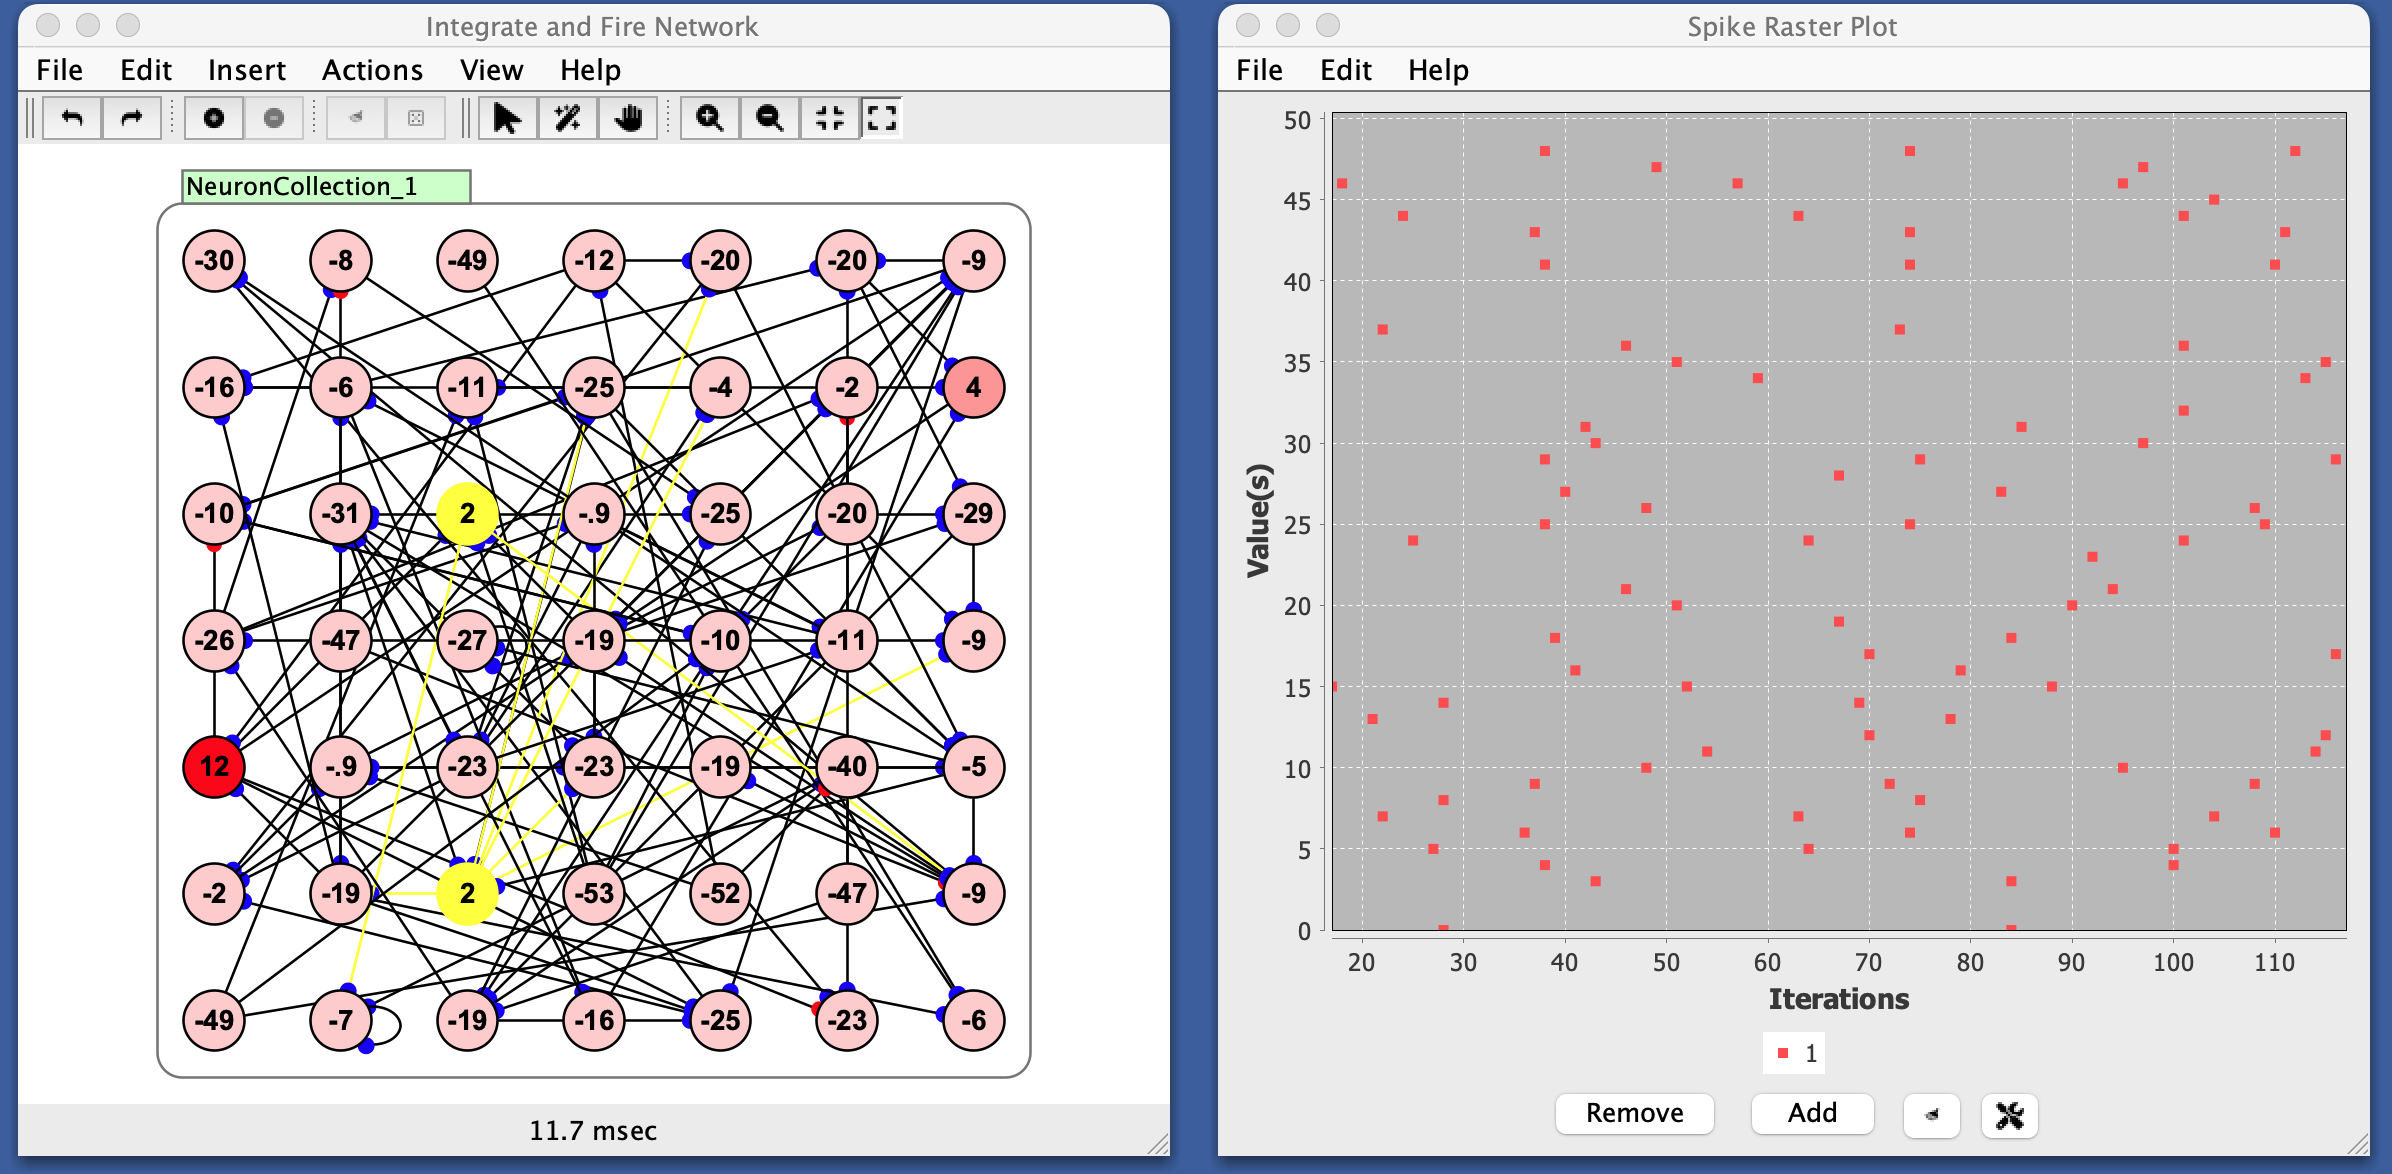
When you see vertical alignments of dots, it means multiple neurons spiked at the same time: often a sign of synchrony or oscillations. The case shown below does not show much spiking synchrony.
Continuous vs. Spiking Neurons
Although raster plots are typically used with spiking neurons, Simbrain allows you to plot neuron activations too. In this case, “spikes” are inferred: if an activation value exceeds a spike threshold, a spike is shown.
When there is a vertical cluster, that means many neurons spiked at the same time, suggesting oscillations. Bands give a sense of the frequency of oscillation.
Preferences
- Dot Size: Size of the dots in the chart.
- Window Size: How many time points can be contained in the window.
- Fixed Width: If true, the raster window never extends beyond the window size. If false, all data to date are plotted (which can start to consume quite a bit of memory).
- Spike Threshold: Threshold used to determine spiking with non-spiking neurons. For non-spiking neurons, activation above this value is treated as a spike.
Panel Buttons
- Add: Add a raster plot series to the plot. Multiple raster plots, shown in different colors, can be superimposed.
- Remove: Remove a raster plot series from the plot.
- Clear Graph Data: Clear all data.
- Show Graph Properties (gear icon): Open preferences dialog.
Menus
File
- Import from XML: Load a previously saved raster plot.
- Export to XML: Save the current raster plot.
- Rename: Rename the raster plot window.
- Close: Close the plot window.
Edit
- Preferences: See preferences.
Right-Click Menu
- The context menu is a JFreeChart menu.