Tables
Simbrain tables are spreadsheet-style components used throughout Simbrain to display data and perform numerical operations (randomization, normalization, filling, etc.). Most table operations are applied by selecting cells and using keyboard shortcuts, toolbar buttons, or context menu items.
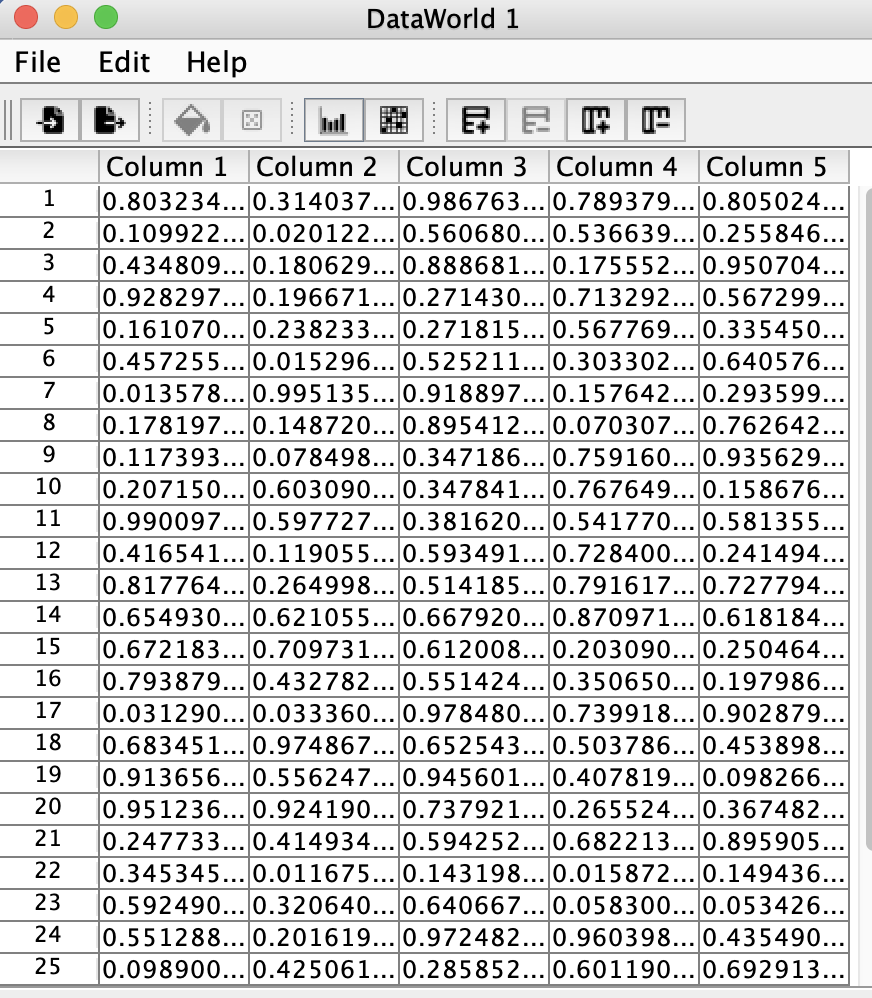
Data World is a Simbrain component based on tables. Tables are also used in various dialogs and for data visualization throughout the application.
Table Operations
Import and Export
-
Import CSV: Import data from a comma-separated values (
.csv) file. Configure whether to include column/row names. -
Export CSV: Export table data to a
.csvfile. Configure whether to include column/row names.
Edit Structure
-
Set Rows / Columns: Change table dimensions. A dialog prompts for new dimensions. All cells are zeroed out.
-
Insert Row: Insert a new row above the selected row (or at bottom if none selected). New rows are initialized with default values.
-
Delete Rows: Delete all selected rows. Multiple rows can be selected and deleted simultaneously.
-
Insert Column: Insert a new column to the right of the selected column (or leftmost if none selected).
-
Delete Columns: Delete all selected columns. Multiple columns can be selected and deleted simultaneously.
Edit Values
-
Fill: Fill selected cells with a specified value. A dialog prompts for the value, which must be compatible with the column’s data type.
-
Zero Fill (Z): Fill selected cells with zero. Faster alternative to Fill when zeroing out cells.
-
Randomize (Ctrl/Cmd+R): Randomize selected cells using the current randomizer distribution (default: uniform). Configure the distribution using Edit Randomizer.
-
Edit Randomizer: Configure the probability distribution for randomization (uniform, normal/Gaussian, etc.). Affects all subsequent Randomize operations.
Visualization and Analysis
-
Boxplots for Columns: Create boxplots showing distribution of values (median, quartiles, outliers) for all numeric columns. Opens in a new window.
-
Show Matrix Plot: Create a matrix visualization of pairwise relationships between row vectors using comparison functions (Correlation, Covariance, Cosine Similarity, Euclidean Distance, Dot Product). If rows are selected, only those are compared; otherwise all rows are compared. Inspired by R’s corrplot package. Useful for understanding high-dimensional data relationships.
-
Plot Word Embedding: Create a PCA projection plot of table data in 2D or 3D. Each row becomes a point. Row labels are displayed as point labels. Useful for exploring word embeddings and high-dimensional data patterns.
-
Show Eigenvalues: Display eigenvalues of the table data as a matrix. Only available for square numeric tables. Useful for understanding matrix properties and dimensionality.
Context Menu and Keyboard Shortcuts
Most table operations can be accessed via:
- Toolbar buttons at the top of the table panel
- Right-click context menu on selected cells
- Keyboard shortcuts (listed with each operation above)
Selection tips:
- Click and drag to select a rectangular region of cells
- Shift+Click to extend selection
- Ctrl/Cmd+Click to select multiple non-contiguous cells
- Click on row/column headers to select entire rows or columns