Data World
Data World is a spreadsheet-based component that sends data to and receives data from other Simbrain components, primarily neural networks. It is closely based on tables and provides a way to stream tabular data into simulations or record outputs from networks.
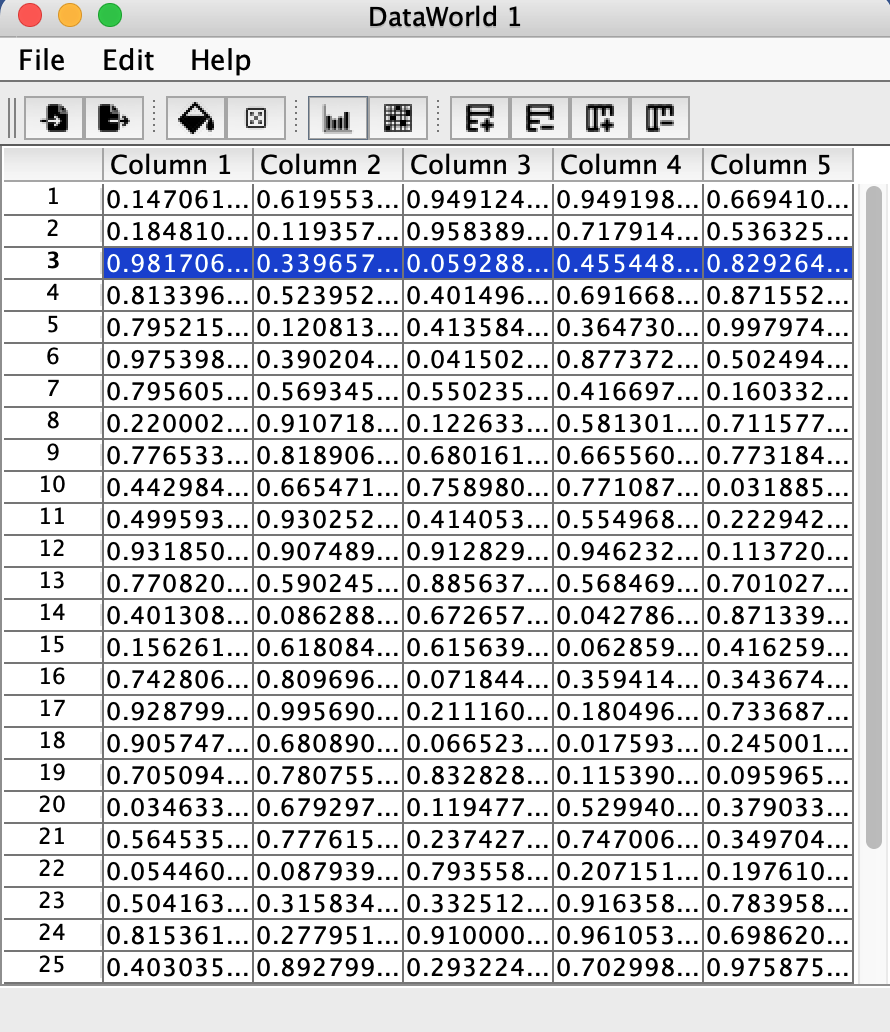
Data World is commonly used to provide input sequences to neural networks via couplings. Each row corresponds to an input or output vector, and each column corresponds to a neuron or component in a network. As the workspace updates, the current row advances (or stays static), and data from that row is sent to coupled components or data from components is written to that row.
Most table operations (randomization, fill, etc.) are applied by selecting cells and using menu items, toolbar buttons, or context menus. See tables for complete documentation of table operations.
Example simulation: Neuroscience > STDP provides a useful demonstration of Data World in action.
Creating a Data World
To create a new Data World component:
Insert > New World > Data Worldfrom the menu- Right click on the desktop and select
Insert > New World > Data World - Click on the world icon and select
Data World
Configuration Options
Data World has two key behavioral settings that control how it advances through rows and handles data writes. These can be configured via File > Data world preferences...
Row Advancement
Controls how the current row advances on each workspace update tick:
- Loop: Advance to the next row and wrap back to row 0 at the end. This creates a continuous cycle through the data.
- Static: Stay on the current row. Useful when manually controlling row position or when the data should not auto-advance.
When Loop is selected, Data World continuously cycles through rows during simulation, making it ideal for repeating input sequences or recording time-series data.
Write Behavior
Controls what happens when data is written to Data World from a coupling:
- Overwrite: Write data into the current row, replacing existing values. The table size remains fixed.
- Append: When writing to the last row, automatically insert a new row after it. This allows the table to grow dynamically as data is recorded.
Append mode is particularly useful when recording an unknown amount of data from a network during a simulation, as the table will automatically expand to accommodate new data.
Couplings
Data World supports both producing and consuming data through couplings:
-
Producing data: The current row (either as numeric or string values) can be sent to neurons, neuron collections, or other components. Select
Edit > Create DataWorld Couplingto create producer couplings. -
Consuming data: Data from networks or other components can be written into the current row. The write behavior setting determines whether data overwrites the current row or causes the table to grow.
-
Coupled plots: Data World can send its current row directly to plot components for real-time visualization. Use
Edit > Couple Plotsto create plot couplings.
Menu Commands
File Menu
- Import: Import Data World configuration from a
.xmlfile - Export: Export Data World configuration to a
.xmlfile - Import CSV: Import data from a
.csvfile. See Import CSV in the table documentation for details. - Data world preferences…: Configure row advancement and write behavior settings
- Close: Close the current Data World window
Edit Menu
- Set Rows/Columns: Change the dimensions of the data table (see Set Rows / Columns)
- Fill: Fill selected cells with a specified value (see Fill)
- Randomize: Randomize selected cells (see Randomize)
- Edit Randomizer: Configure the randomization distribution (see Edit Randomizer)
- Couple Plots: Create couplings to plot components for real-time data visualization. The current row is sent to the plot at each workspace update.
- Create DataWorld Coupling: Open the coupling interface to create connections between Data World and other components
Toolbar and Context Menu Operations
Data World includes a toolbar and context menu with operations inherited from the table utility:
- Insert Row / Insert Column
- Delete Rows / Delete Columns
- Fill / Zero Fill
- Randomize (keyboard shortcut: Ctrl/Cmd+R)
- Boxplots for Columns
- Show Matrix Plot
Refer to the table documentation for complete details on these operations.