Property Tabs
At the bottom of the Simbrain desktop is a dock panel (invisible by default; to view it go to View > Bottom dock or use the toolbar button) that contains tabs for monitoring and controlling the workspace.
Components
A list of the components in the workspace. Each row corresponds to one component and contains these columns:
- Component: The name of the component.
- Type: Shows the kind of workspace component (network, bar chart, time series, etc).
- GuiOn: A checkbox to enable (default) or disable the component’s GUI. Disabling this will visually remove the component from the workspace, which can improve performance by lowering computational time and memory usage.
- Update On: A checkbox to enable (default) or disable updating of the component. If this option is not selected, the component will not update when the workspace is iterated (see Updates for more information).
Terminal
A Beanshell terminal providing command-line access to Simbrain’s features. You can use this to interact with the workspace, components, and other Simbrain objects programmatically. See the console documentation and simulations for more information.
Performance
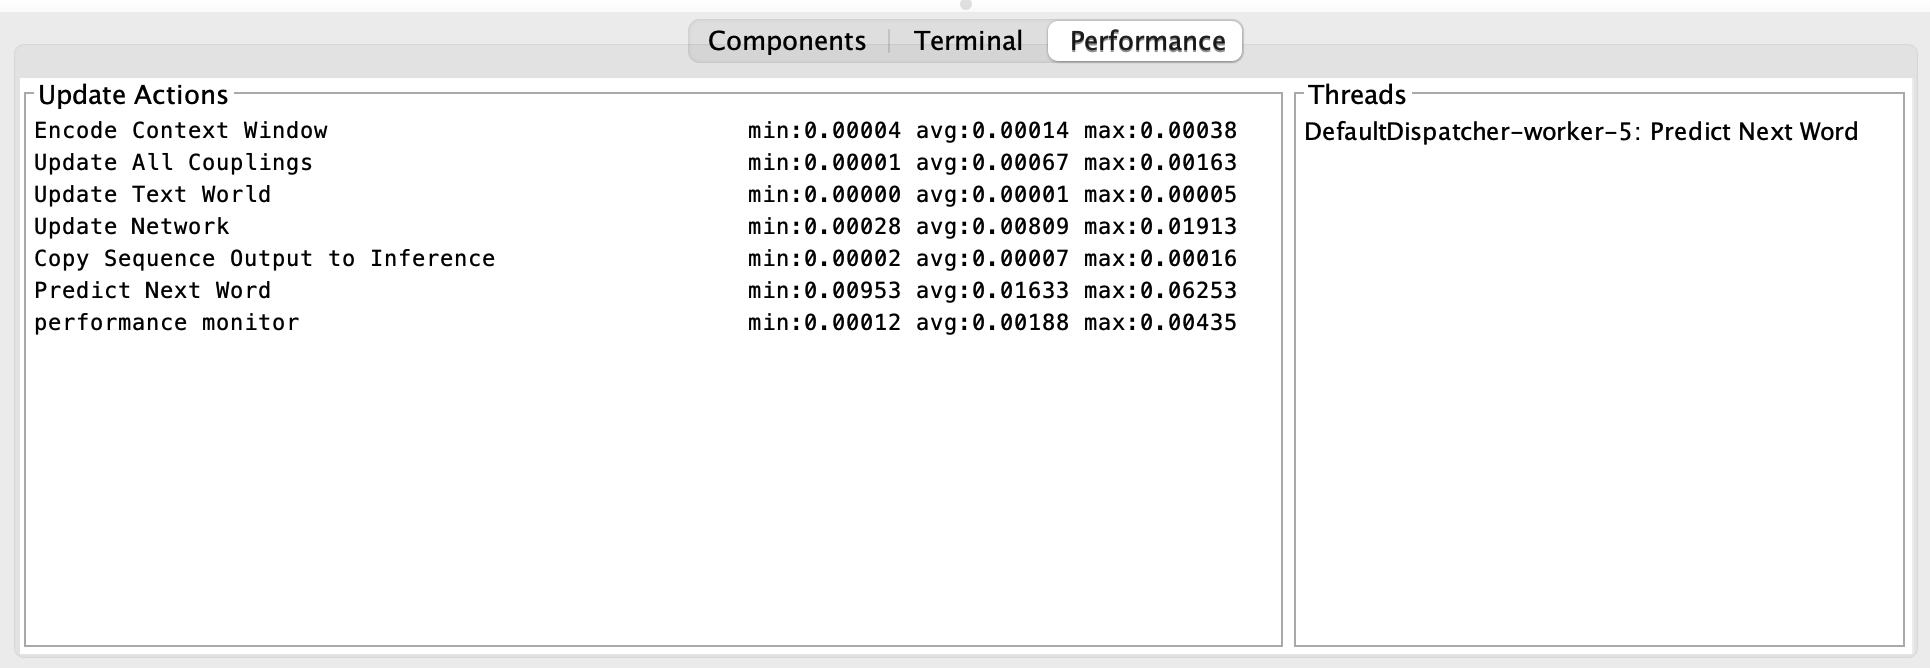
The Performance tab displays real-time metrics about workspace update cycles, which is helpful for identifying performance bottlenecks in complex simulations. The panel is organized into two sections:
Update Actions - Shows timing statistics for each update action in the sequence so far:
- min: Fastest execution time (in seconds)
- avg: Average execution time (in seconds)
- max: Slowest execution time (in seconds)
All three stats are computed over all workspace updates since when the monitor was displayed.
This shows you which components or actions are taking the most time to update. For example, if “Update Component: Network 1” has a much higher average time than other components, that network may be a performance bottleneck.
Threads - Shows which threads are currently executing which actions. This is useful for understanding concurrent execution and verifying that components are updating in parallel as expected.
Performance monitoring is only active when this tab is selected, so it won’t affect performance during normal simulation runs.