Time Series
A time series plot allows you to track changes in a set of variables over time. Time is represented on the x-axis. Here time corresponds to simulation time in Simbrain. For example, the spike pattern of a spiking neuron can be viewed by attaching the spiking neuron to a time series plot, as in this example.
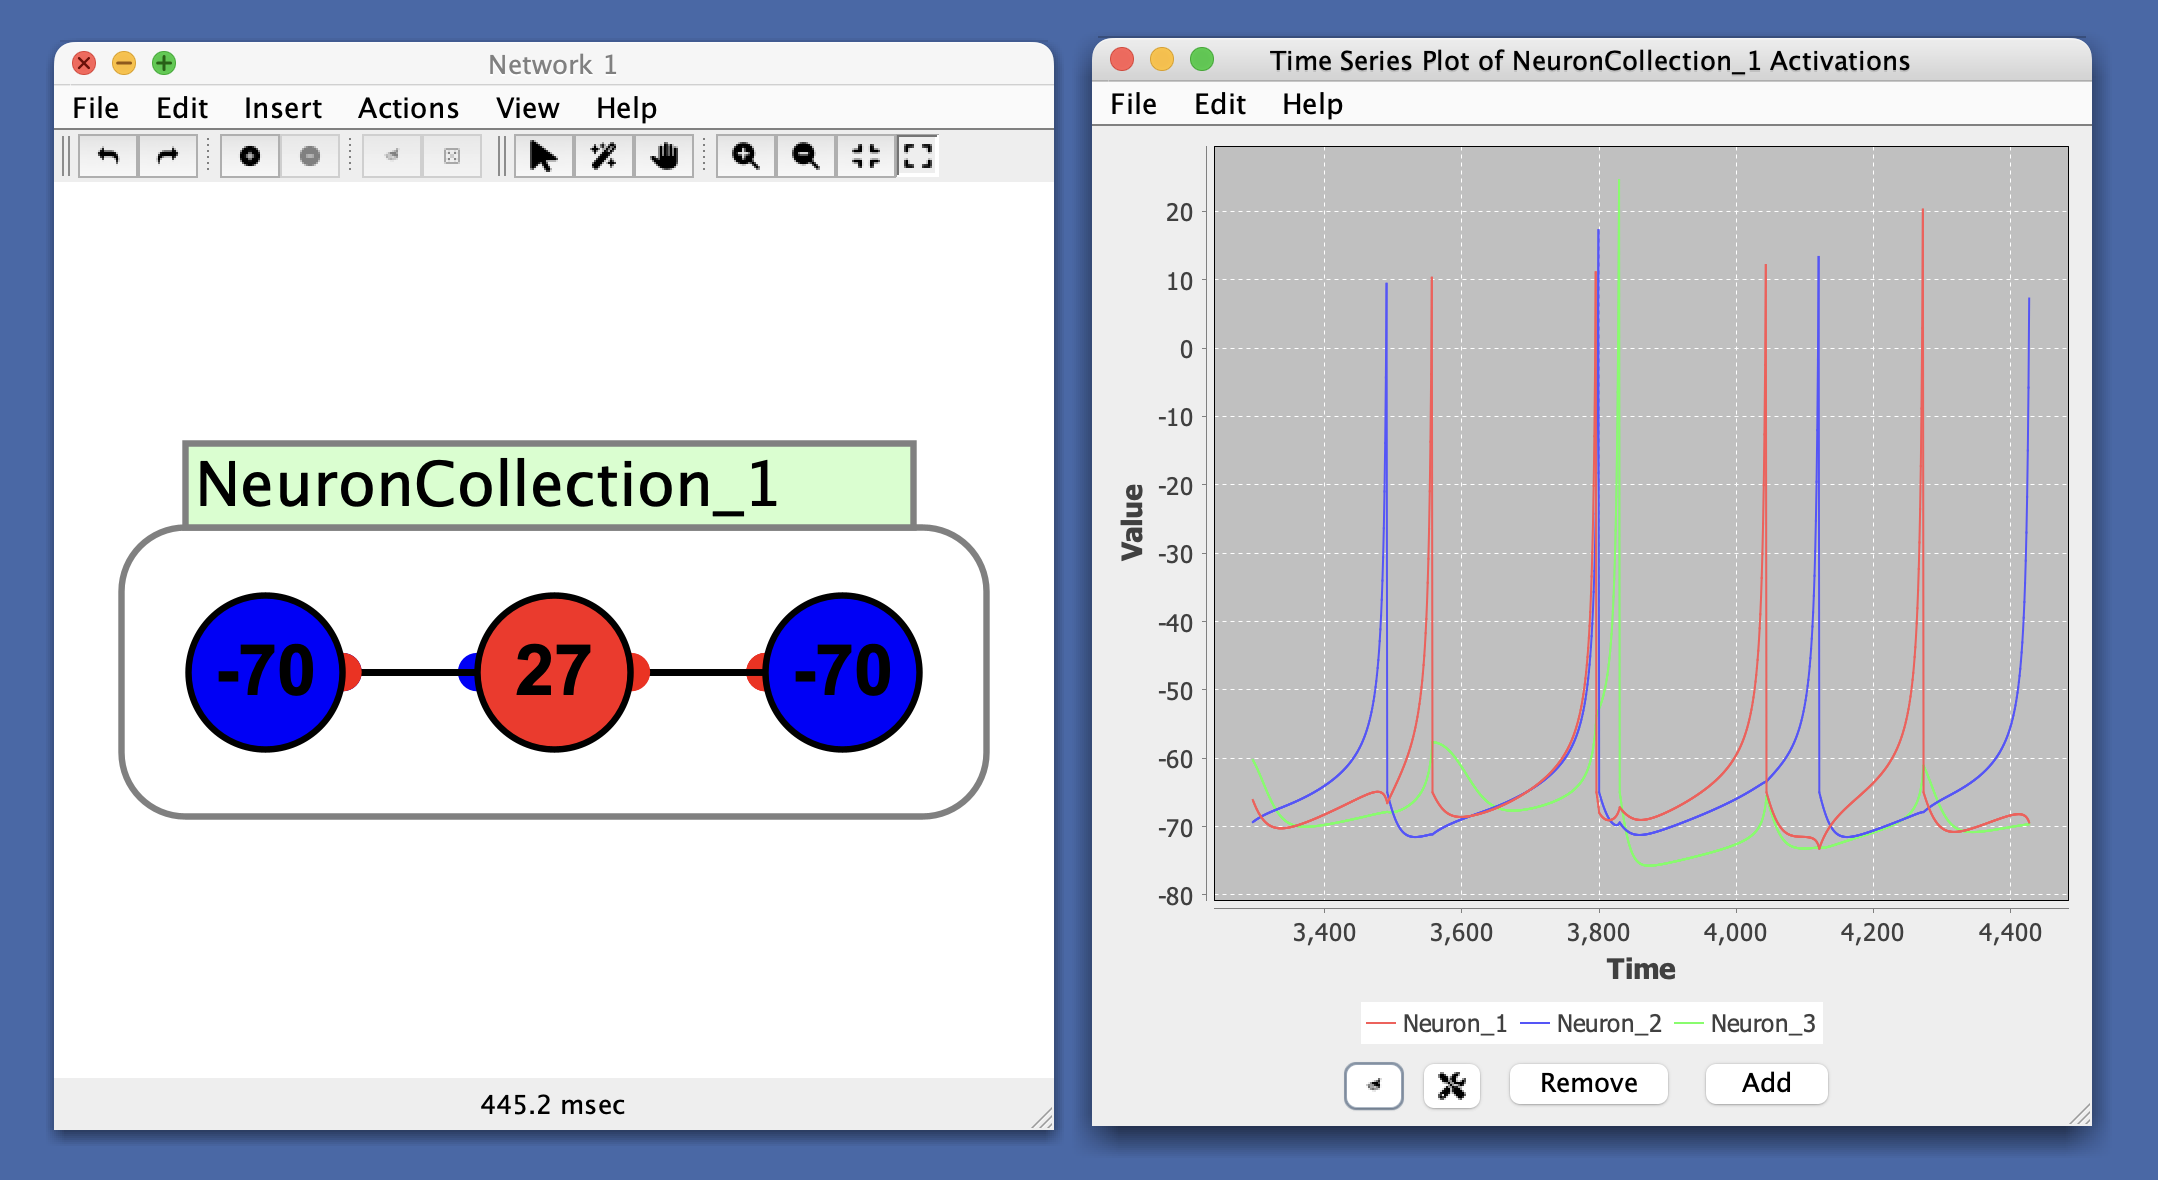
Panel Buttons
- Add: Add a time series to the plot.
- Remove: Remove a time series from the plot.
- Clear Graph Data: Clear all data from the plot.
- Show Graph Properties: Open the properties menu for the plot.
Preferences
- Auto Range: When selected, the y-axis is automatically scaled so that the series with the greatest magnitude fits inside the window. It can be useful to turn this off to get a better sense of overall changes in magnitude, since while it is on they will fill up the window.
When auto range is enabled, the y-axis continuously adjusts to fit the current data range. This can create a misleading impression that values are changing more dramatically than they actually are. For example, when tracking training error, auto-range can make it appear that error is improving significantly when in fact the scale is simply adjusting to show smaller values more prominently. This same issue can occur in bar charts where relative values can appear misleadingly large or small. To address this, you can use the auto range bounds settings below to constrain how much the range can adjust, or turn off auto range entirely and set fixed bounds using Range Lower Bound and Range Upper Bound.
- Range Lower Bound: Minimum value of the y-axis (when auto range is off).
- Range Upper Bound: Maximum value of the y-axis (when auto range is off).
- Auto Range Minimum Upper Bound: When auto range is on and this option is enabled, if the computed maximum value is less than this bound, the range will be set to this value. This prevents the range from becoming too small and helps maintain a consistent scale for better comparison over time.
- Auto Range Maximum Lower Bound: When auto range is on and this option is enabled, if the computed minimum value is greater than this bound, the range will be set to this value. This prevents the range from shifting upward too much and helps maintain a consistent scale.
- Fixed Width: When selected, maintains a fixed amount of time points displayed in the plot.
- Window Size: Width of the x-axis (number of time points to display when fixed width is enabled).
Menus
File
- Open: Load a previously saved time series.
- Save: Save the current time series.
- Save As: Save the current time series with a new name.
- Close: Close the time series window.
Edit
- Preferences: See preferences.
Help
- Help: Link to Simbrain Documentation
Right-Click Menu
- The context menu is a JFreeChart menu.